BUSAN 301 - Data Visualisation

Faculty
Business and Economics
Department
Info Systems & Operations Mgmt
Points:
15
Available Semesters:
{}
Course Components
Labs
Tutorials
Lectures
Exam
TBLs
Workshops
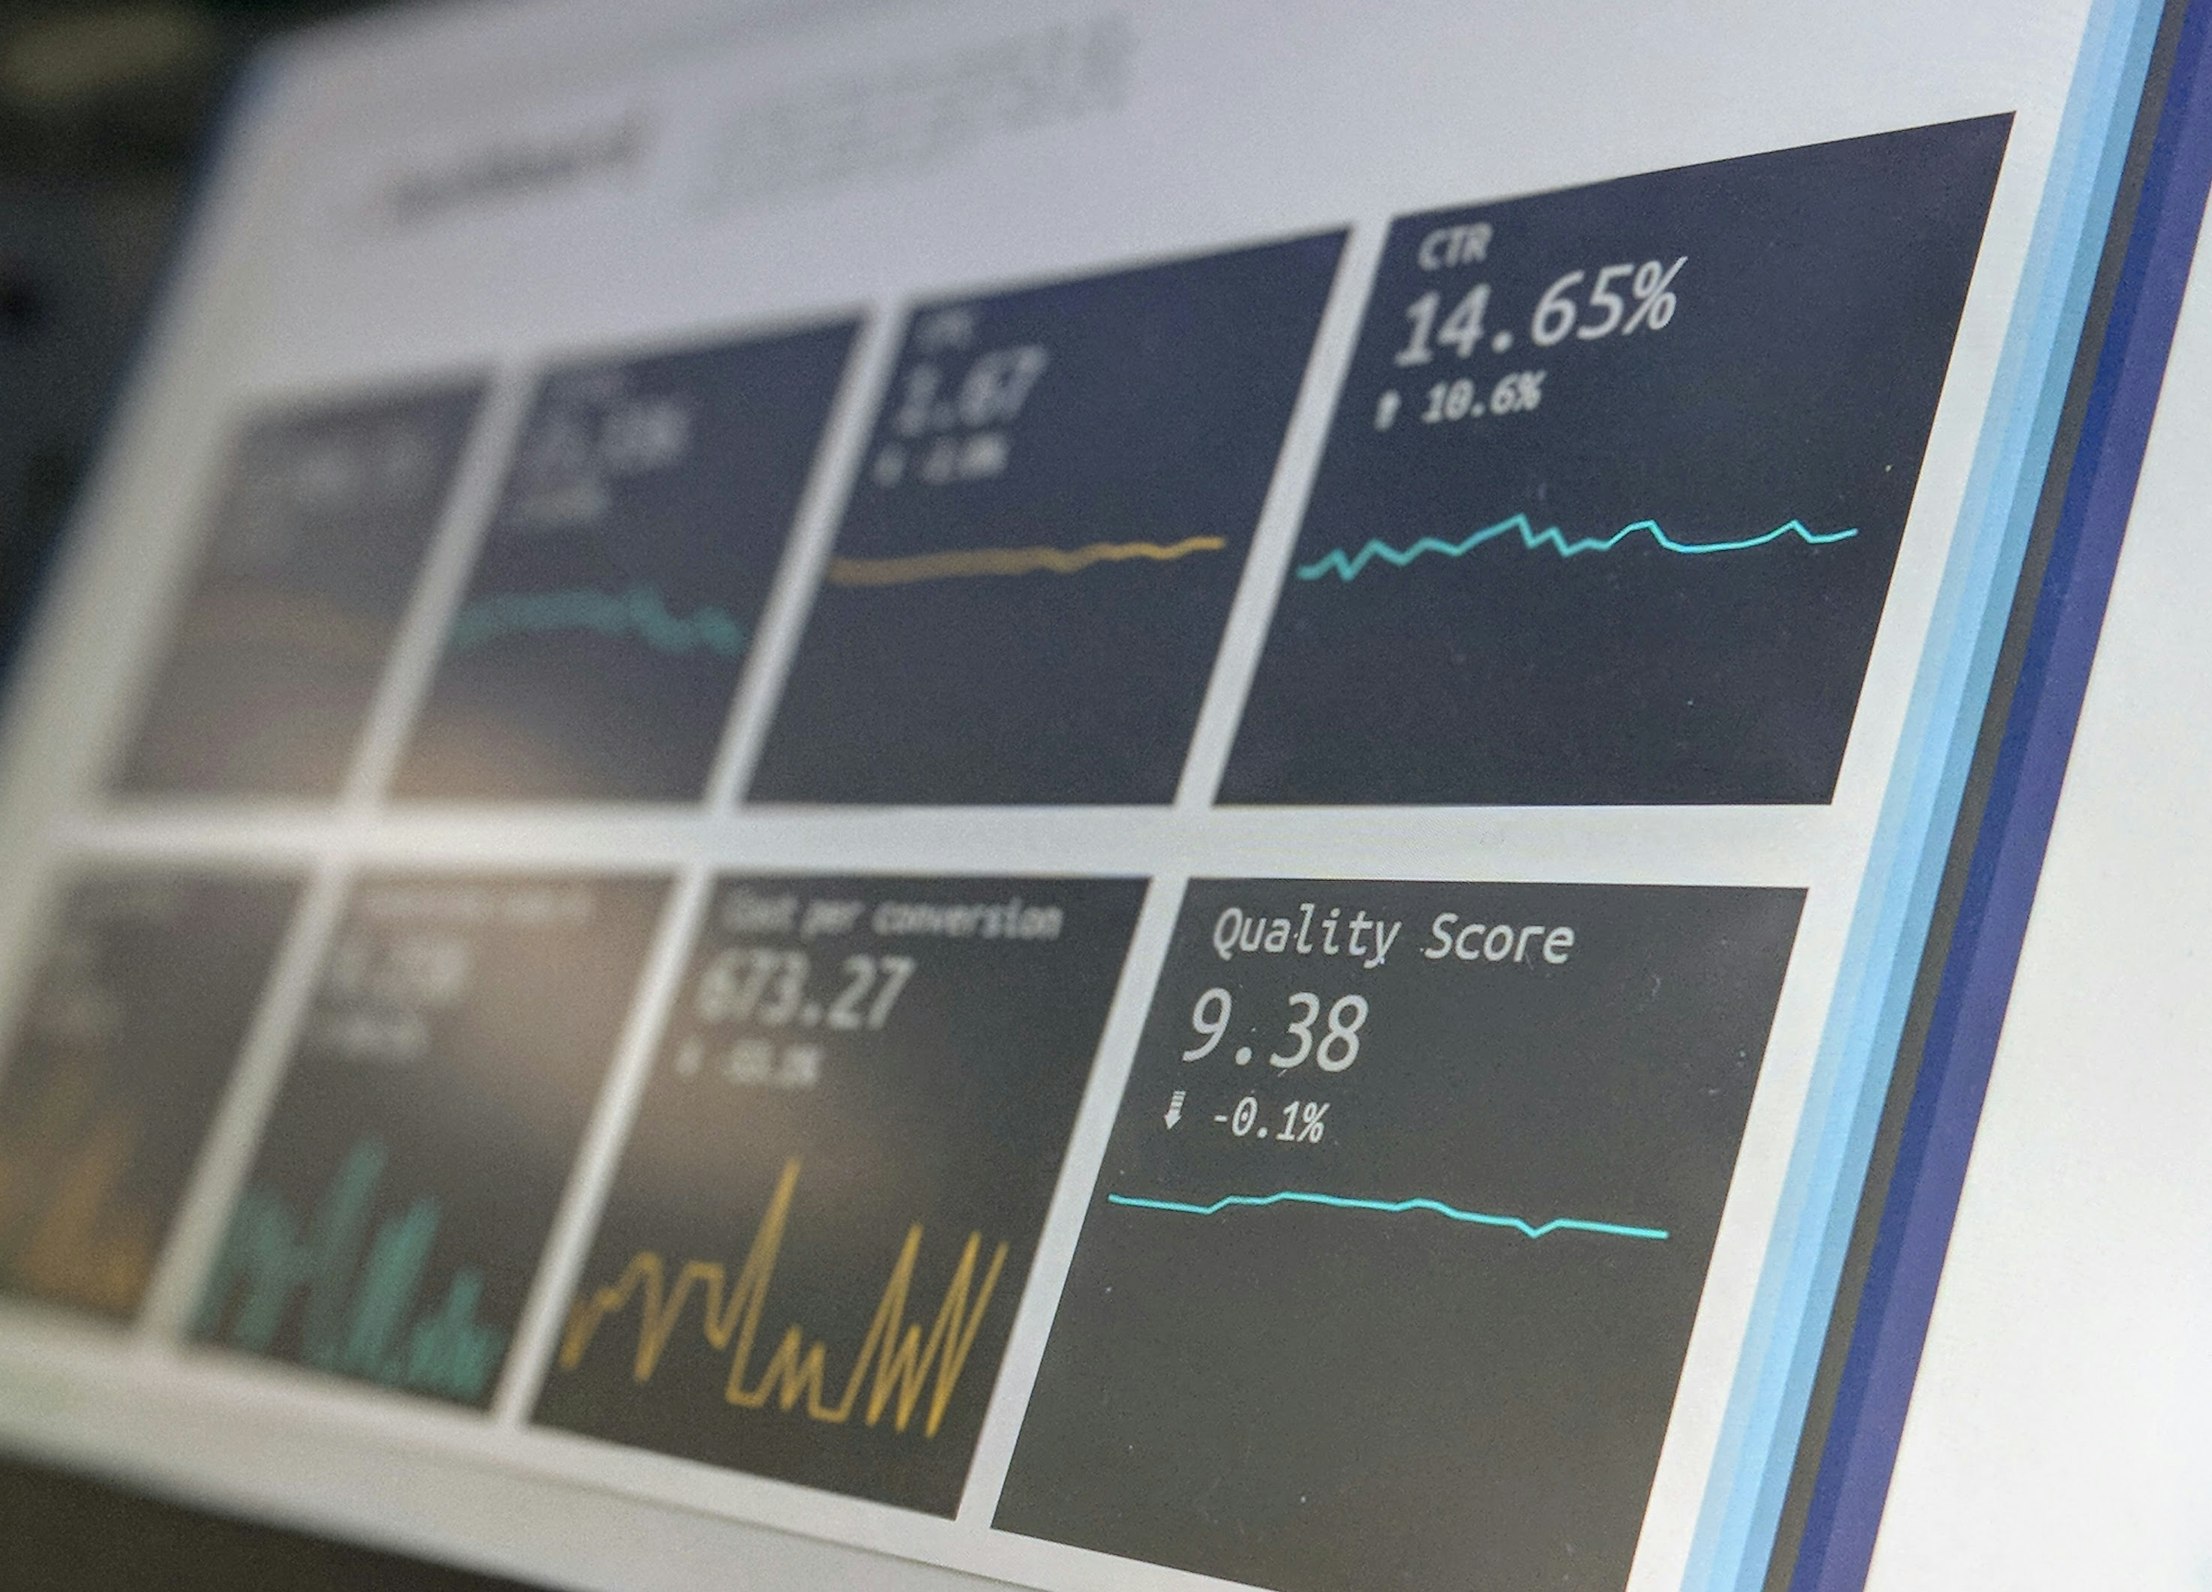
Description: Visual representations of data enable complex ideas to be communicated clearly and effectively. Covers how to better engage decision makers via data visualisation. Focusses on transforming data into visual digital narratives using modern visualisation tools.
Prerequisites / Restrictions
Prerequisite: 30 points from BUSAN 200, 201, ECON 221, INFOMGMT 290-296, INFOSYS 220-280, STATS 208, 255 Restriction: INFOMGMT 392
Average Rating From 3 Reviews
Teaching Quality
6.7 / 10
Content Quality
6 / 10
Workload
4.7 / 10
Difficulty
4.3 / 10
67% - Would Recommend
33% - Would Not Recommend
Reviews